


Reserve Fund Studies (Part 2)
The RFS Cash Flow Tables show that the future contributions will meet the expected rate of inflation. However, that does not always occur.
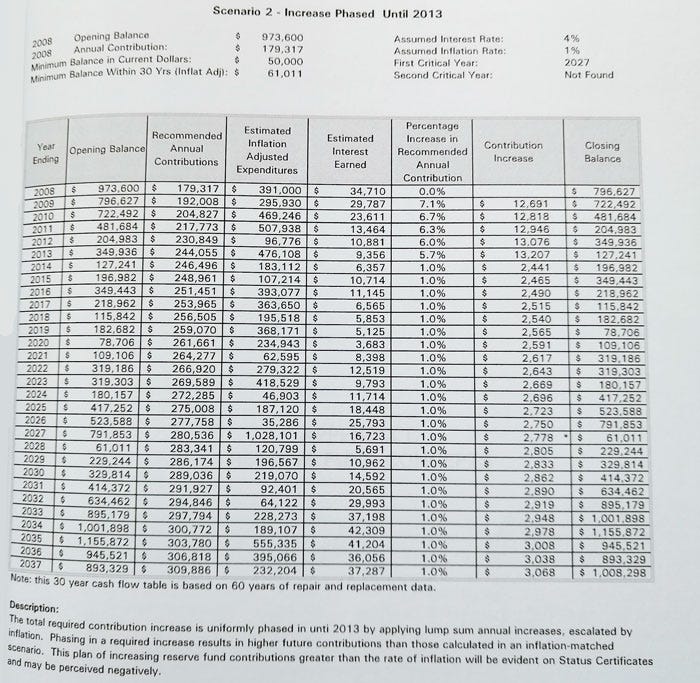
In this 2008 Reserve Fund Study cash flow table, the engineers recommend the following yearly increases:
2009 7.1%
2010 6.7%
2011 6.3%
2012 6.0%
2013 5.7%
2014 1.0%
The recommended funding increases for all remaining years is 1%, the estimated annual inflation rate.
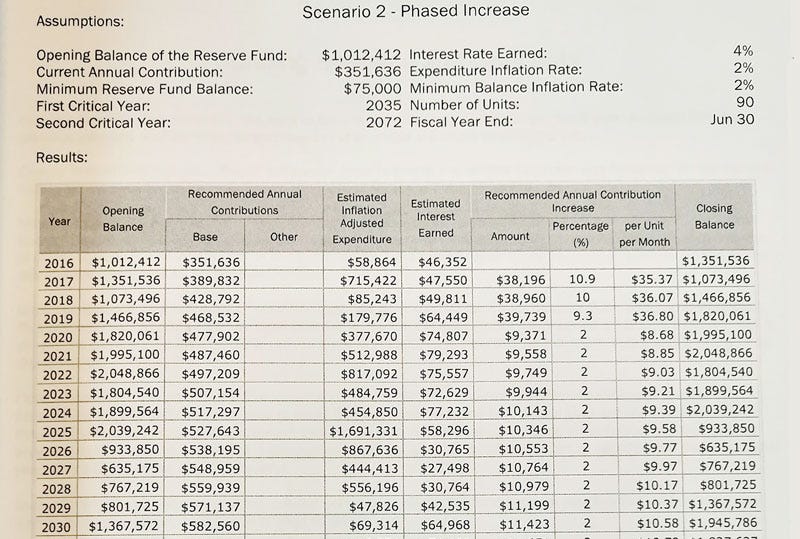
In this 2016 Reserve Fund Study cash flow table, the engineers recommended the following yearly increases:
2017 10.9%
2018 10.0%
2019 9.3%
2020 2.0%
The recommended funding for all future years remain at 2%, the estimated annual inflation rate. Both studies are for the same condo corporation and done by the same engineering company.
Here is a history of the Recommended Contributions that was approved by the Board of Directors.
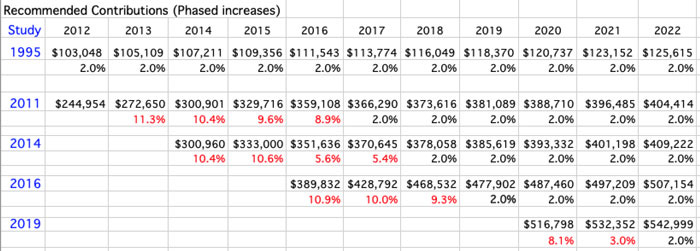
The 1995 study is used as a base. Looking at just the top row for 1995 makes it look like this condo has all of its Reserve finances in great shape. Doesn’t it?
Now look at the actual increases. All the years in red show the increases that exceed the rate of inflation. So the Recommended Contributions tables that are sent to all the owners every three years don’t mean much do they?
Reserve Fund Studies Part Three
In Reserve Fund Studies Part Three, I will explain why expensive work gets pushed out into the future which can result in far higher costs.